
#27: A Return, A Reboot, A Reflection on the Future in Five Charts
This newsletter returns after a long hiatus. Halfway through the pandemic decade, energy is more associated with supply chain security than climate targets. What has changed, and what still matters?

PRESSED FOR TIME?
After a (too) long hiatus, Climate + Money returns. The early 2020s, when this project began, seem a distant past. But risk and price and value and exposure have continued to give us data points on what the future holds. In this issue, we look at five simple charts. You should take an interest in that. And you should still subscribe, because it’s still FREE.
WE ARE BACK! WHAT A DRY SPELL…
Welcome back. It’s great to see you again, still opening newsletters and showing interest in our changing climate.
We are in the midsts of a reset. Not just for this newsletter.
Wait, where did you go?
I continued to work on these questions, but with different hats — many of which blew away in the wind. That journey is best covered in a Washington Post profile piece, found here. I spent time helping on a few projects at the Harvard Center for Green Buildings and Cities. I went down rabbit holes and strange paths on climate-related population fragility and insurance deserts and other curiosities, and many of those insights now sit inside a data platform called Coastline. I also had a second child.
And now we’re here, in this moment of reflection.
Over the coming weeks, I will share a four-part series called ‘The Great Reset’ — it will attempt to sift through the doom, gloom, good news and better than good news, to give this audience a clearer picture.
MY WORLDVIEW: SAME SAME, BUT DIFFERENT
But first, I want to set out my priors, and within the bounds of impartiality, give my ‘take’.
Humanity has always done amazing things when energy has been low cost, widely available and reliable. Right now, we need a lot more energy.
Having abundant electrons that we can use to fuel economic growth and meet rising demand for energy in the United States — which is happening for the first time in decades — is a public good. In a perfect world, I would like those electrons to be generated through methods that don’t give pit miners black lung (coal), or release methane or produce toxic pipe leaks in our apartment buildings (natural gas), or make the scenery less visually appealing with huge spinning turbines (wind), or lead to plant failure risks (nuclear), or take up so much horizontal land with PV panel facilities that the land can’t be used for anything else (solar).
We are in a world of tradeoffs. No energy source is perfect. No energy source costs zero, or has a static, continuous supply chain. There are sensible conversations to be had about the better ones, and the right mix. It takes work and money to move electrons. No energy source is reliable and as of yet, able to meet all the scenarios we need electrons for, at the times we need it. There are legacy reasons for every choice made to this point.
We need more energy, and we need to decarbonise. The reality is the world does not have two eyes on decarbonisation. The pandemic, inflation and energy security have recast priorities. Certainty in the now trumps targets in the future.
I would still like to live in a 1.5C world, and that is now unlikely. When my father was born in 1946, there were 310.2 parts per million (ppm) of CO2 in the atmosphere. When I was born in 1983, it was 342.7ppm. Today? 427.5ppm.
Nonetheless, a narrative is gathering since the Trump Administration’s return to the White House, that net zero is now doomed, and our planet is going to be unliveable for our children, and there’s almost no point in ‘fighting’. Another way to say this?
Climate has been framed as a physical, scientific problem where there are hard limits: If we do not fully solve the problem and get to net zero emissions by some deadline, or if we don’t keep to 1.5 degrees, then we’re in a Marvel hero film where the good guys have failed.
I wholly, utterly reject this mindset. It ties victory (or defeat) to political cycles (which none of us control). It uses panic as a call to action. It doesn’t consider economic realities. It sets this challenge in a guilt and responsibility lens, as though there is a virtuous ‘climate action’ segment of our economy (aka “the good guys”) who would sacrifice higher energy bills for a faster, cleaner transition. There is absolutely no data to support this. In fact, climate coalitions fracture very fast when the cost of living outpaces wages.
Every degree of warming matters. We do need to decarbonise as fast as possible. But the last few years warrant introspection.
THE ANALOGY: A THREE-WAY HANDSHAKE
The best analogy I can muster? This challenge is like attempting a three person handshake between technology, society and politics.
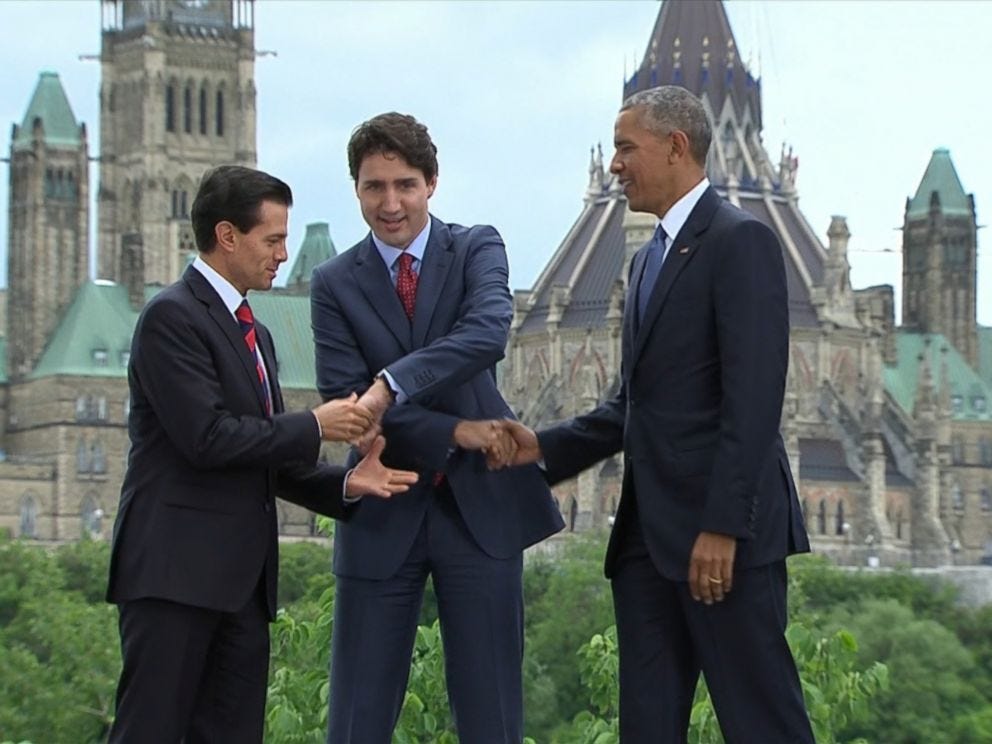
There’s no clear way to do it.
Technology is interested in a base load of energy to execute and experiment with, so everything runs on time. It needs generation, transmission and storage systems that can manage the disruption of a heatwave or cold snap, and accommodate a big new change like AI data center demand. It’s also important to have diversity of source, and to manage the integration of new energy technologies as they become safe and scalable.
Society is interested in stability. People really, really don’t like change. But paradoxically, they want things to be improving.
Politics is interested in managing change, which is happening all the time, in increments. Politics by definition is about contesting ideas and setting up disagreement.
None of these three domains welcomes a growing fragility in the way our planet functions. Each needs the others. All need as much as stability as possible. So we are looking for, or have been looking for, positive change in increments.
A BATTLE OF THE FEEDBACK LOOPS
We’re in a race — a race between the feedback loops in the climate system and the feedback loops that we’ve been trying to cultivate politically, where we drive down the cost of clean technologies and build political will for a world that for most people, day-to-day, doesn’t feel that different or disrupted, but still avoids ever-rising emissions.
The way we’ve been talking about this race hasn’t worked.
I will say more on this over ‘The Great Reset’ series. But it’s important to think of all the occasions in the last half-decade where you or I have been so certain of a perspective, and been unable to convince someone. In debating, and life, it’s incumbent on the advocate to reflect when persuasion in one method doesn’t work.
So let’s together look at five charts, or data points, and ask how we’d talk about this challenge in a new way? What is the story we want to try and tell ourselves first? I’ve leant on the wonderful Nat Bullard to stimulate that discussion.
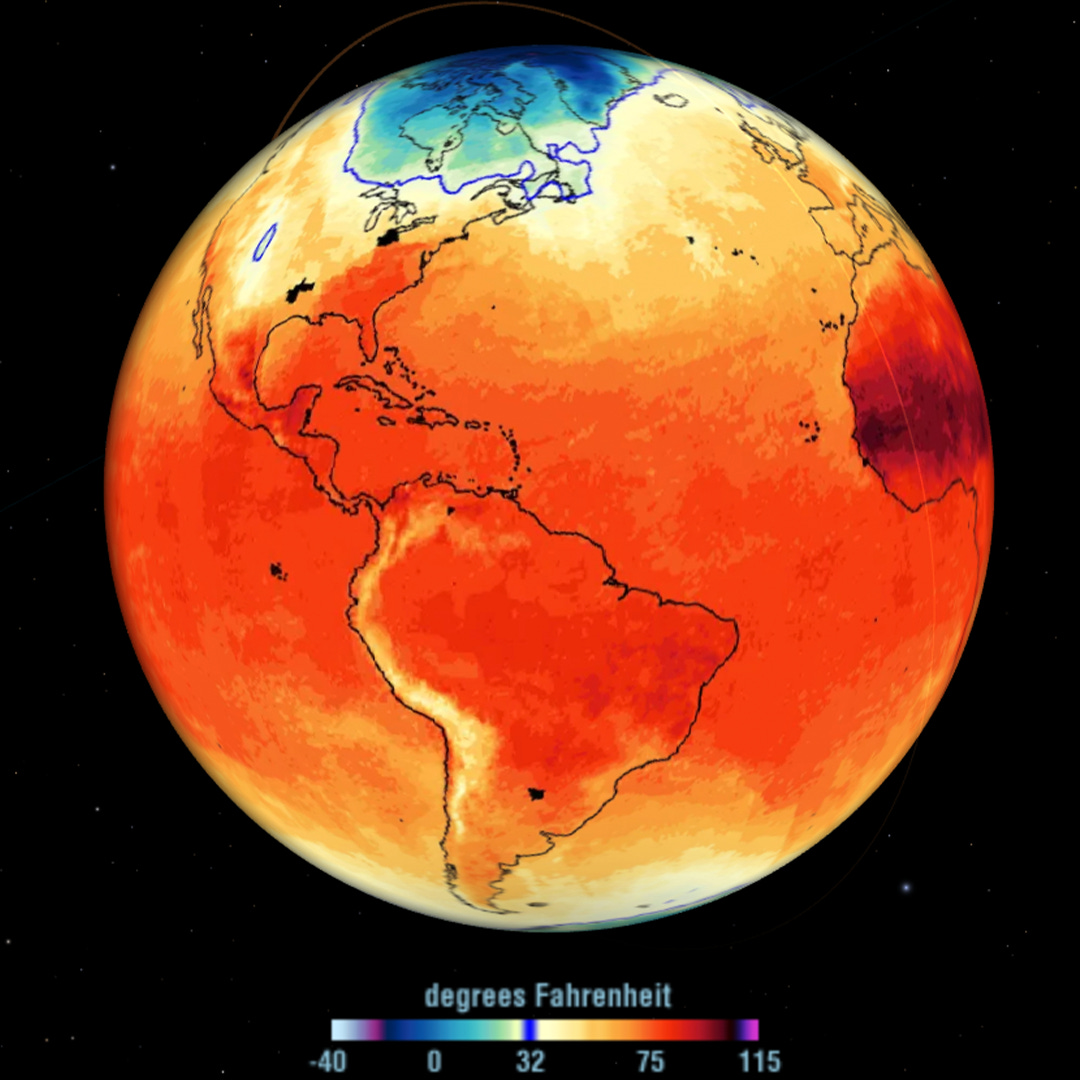
CHART 1: THE BAD NEWS IS STILL BAD
It’s not pleasant to contemplate, but we do need to remind ourselves occasionally in a world with so many distractions.
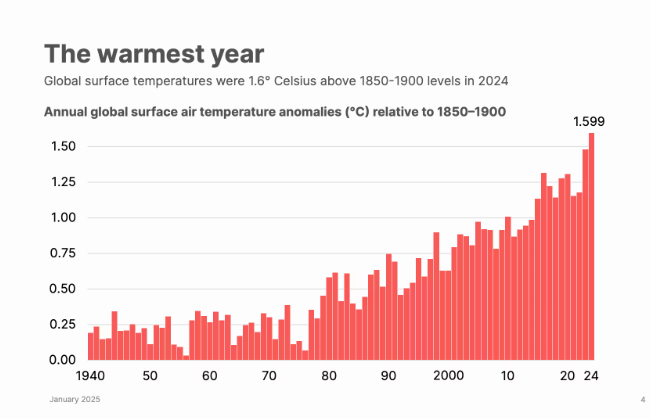
A good way to frame the rate of overall warming would be like this —
Earth is 4.6 billion years old. Let's scale that to 46 years. We have been here for 4 hours. Our industrial revolution began one minute ago.
In the single minute we’ve been burning fossil fuels to build a modern, globally connected world, we’ve pushed through the 1.5C threshold scientists always hoped we would avoid.
This happened in 2024, and is obviously not good. For those who wish to totally abandon the path to decarbonisation and generate energy however we wish simply on lowest present day cost, this grim fact is worth remembering.
CHART 2: WIND AND SOLAR’S RISE IS REMARKABLE
Don’t be scared by the metrics. The world is so much easier to understand with a little literacy on this. Let’s do it together.
Power measurements like kW, MW, GW, and TW can be confusing. The best way to make them relatable is to connect them to everyday objects and scenarios. The key is that these are all measures of power, which is the rate at which energy is used or produced. They all have scales that once you remember, become intuitive.
(Kilowatt, kW): A typical household — The total power consumption of an average American home at any given moment is usually 1 to 2 kW. This would cover lights, a refrigerator, and a few small electronics running at the same time.
(Megawatt, MW): A large building — A large commercial building, like a hospital or a university campus, might have a peak power demand of 1 MW.
(Gigawatt, GW): A city's power — The city of San Francisco has a peak power demand of approximately 1 GW.
(Terawatt, TW): A large country — The total instantaneous power demand of a large industrialized country, like the United States, is in the range of 1 TW.
NOW, WE ADD THE TIME THE ENERGY IS BEING SUPPLIED. . .
The simplest way to explain kilowatt-hours (kWh), megawatt-hours (MWh), and gigawatt-hours (GWh) is to connect them to the power units (kW, MW, GW) you're already familiar with, but with the added dimension of time. The key to this is a simple formula:
Energy (kWh) = Power (kW) × Time (hours).
Kilowatt-hour (kWh)
A kilowatt-hour is a thousand watt-hours. This is the unit you'll see on your monthly electricity bill.
Energy of an appliance: A 1 kW microwave running for one hour uses 1 kWh of energy. In the U.S., the average cost of electricity is about $0.17 per kWh. So, running that microwave for an hour costs you around 17 cents.
Megawatt-hour (MWh)
A megawatt-hour is a million watt-hours (or 1,000 kWh).
Energy for a hospital: A very small town or a large corporate campus might use 1 MWh of energy in a single hour.
Gigawatt-hour (GWh)
A gigawatt-hour is a billion watt-hours (or 1,000 MWh).
Energy for a city: The city of San Francisco consumes about 4.1 GWh of energy in a single day.
And as for terawatt hours (TWh)? The US consumes 4,000 TWh of electricity each year. So here’s the good news, now something like a TWh has context: we’re living in an age where new, clean generation sources are becoming competitive at a scale no other source in human history could’ve dreamt of.
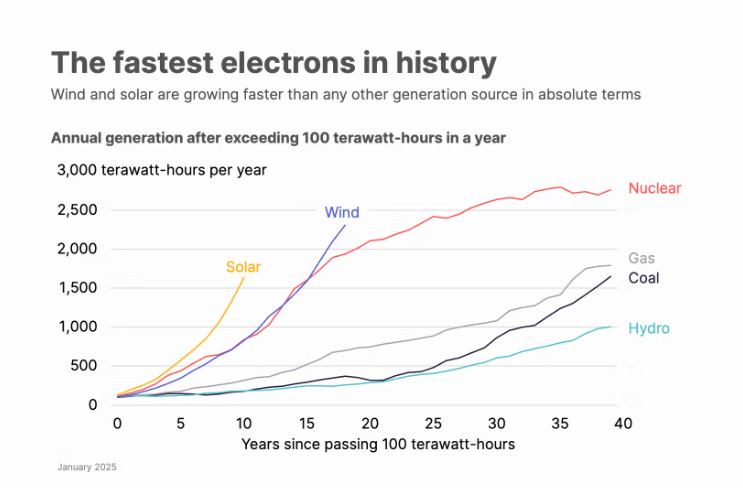
Some numbers to stress this success story:
Solar and wind comprised 17% of US electricity in 2024, surpassing coal (15%) for the first time (link)
The U.S. added nearly 50 GW of solar capacity in 2024 (that’s fifty San Francisco’s of peak power demand) (link)
Wind added 2.1 GW to the US grid in Q1 2025, despite the changing political winds (link)
Policy uncertainty matters in the short term, but clean tech has unit economics that will continue to chalk up large gains.
CHART 3: COAL OUT, GAS IN IS NOT A BAD DEAL
The below chart shows the holistic US energy in Btu since (roughly) the end of WWII.
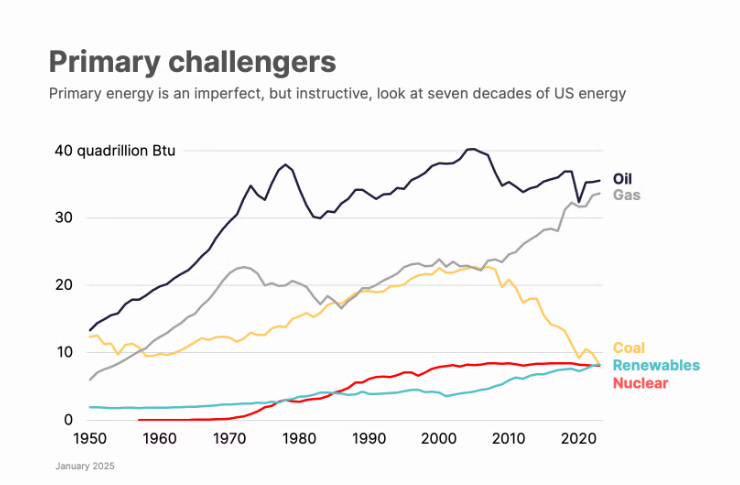
Notice something about the shape of gas and coal’s movement on the chart since the beginning of the Obama Administration, circa 2008-2009? They’re practically inverted. Natural gas began rapidly displacing coal in the U.S. electricity mix. Why? A few reasons.
This was the gun going off on the fracking revolution. U.S. natural gas prices plunged from $8–10/MMBtu in 2008 to $2–3/MMBtu by 2012, undercutting coal on cost for power generation. BUT: that’s not the whole story. Combined-cycle gas turbine (CCGT) plants became cheaper, faster to build, and more efficient (thermal efficiency rose above 60%). Ageing coal fleets faced (timely) retirements. U.S. power sector emissions fell ~28% from 2005 to 2018, with ~50% of that reduction attributed to coal-to-gas switching, and the rest to renewables and efficiency.
There was, and is still is, a big caveat. Natural gas burns cleaner (about ~50–60% less CO₂ per Btu than coal), but methane leakage (2–3%+ of production) offsets part of the benefit. Methane is ~80× more potent than CO₂ over 20 years. It’s bad, bad, bad and why we can’t speak of natural gas as a long term solution for everything (more on this in future issues). Part of the mix, yes. But not at the expense of renewables with a credible storage plan. But in short, coal is on the way out.
CHART 4: THE DEVELOPING WORLD HAS EVERY CHANCE TO CHERRY-PICK THE BEST OPTIONS
What about the developing world? It has myriad challenges. But to reach the solar penetration levels seen in the chart below, it took wealthy nations many more years (often decades).
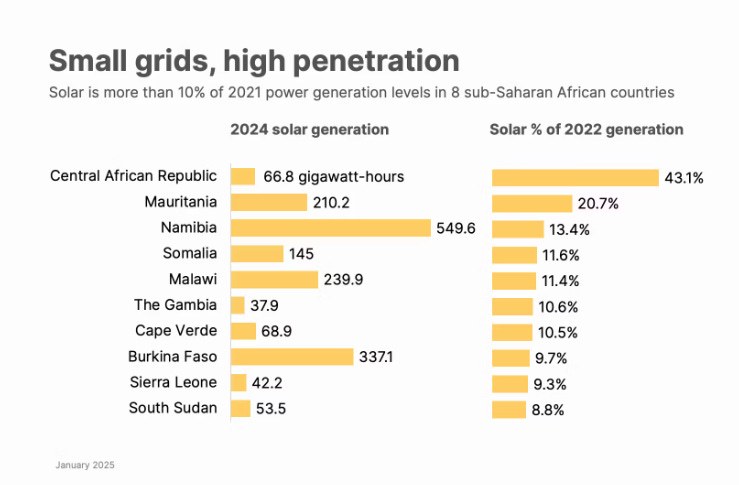
It depends on the stats you wish to pick. From the first commercial PV systems (late 1970s) to 10% grid share in leading OECD nations, this took ~40–50 years. It has taken the countries above barely 10 years. How? They jumped straight to off-grid and distributed systems.
CHART 5: THE BATTERIES ARE COMING
The great (and fair) criticism on renewables has always been their intermittent nature. Battery storage is necessary for renewable generation to credibly solve for a much larger part of base load power, and the electricity mix overall. Some other good news is batteries are coming, in a big way.
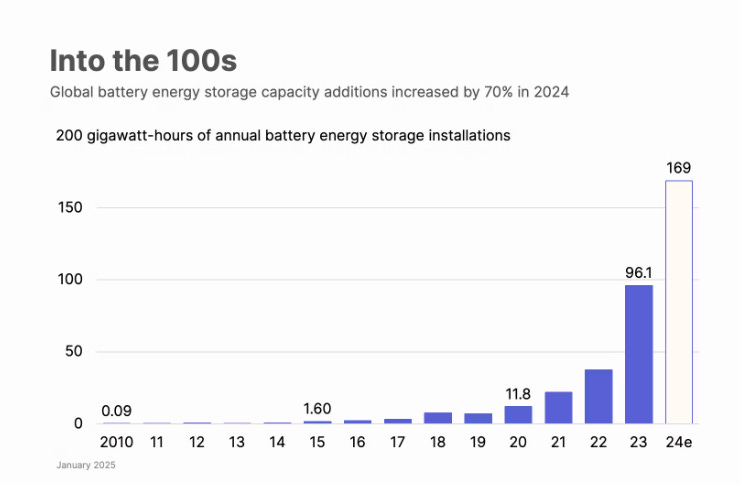
U.S. battery storage capacity surged 66% in 2024 alone, with 10.3–12.3 GW added last year, pushing cumulative utility-scale capacity past 26 GW—up from just 0.059 GW in 2010. In effect, there was no battery capability fifteen years ago: now it’s 26 San Franciscos (link)
The U.S. is on pace to add 18–19.6 GW of utility-scale battery storage in 2025—a potential new annual record (link)
Outside the US, there is also positive news. Global grid-scale storage jumped from just 3 GW in 2018 to 56 GW (~200 GWhrs) by end-2023
SHOULD THIS ALL MAKE ME FEEL BETTER?
Honestly, it should.
The energy transformation is on the cusp of reaccelerating. Nuclear and renewable energy are likely to continue to expand rapidly in the years to come. Fossil fuels, however, will also expand — just more slowly — as natural gas replaces oil and coal fades. Climate concerns, however, will not be the main driver. We all need to adjust to this new landscape. Energy transformation will be driven by the quest for security, with nations creating a diversified energy mix to insulate themselves (and investment portfolios) from geopolitical, macro, and financial risks.
As I will explore in the ‘Great Reset’ series in the coming issues, there’s plenty of new considerations. But we shouldn’t lose sight of the good news in most of these charts. Sometimes to win at the battle of persuasion, we need to persuade ourselves that there is cause for hope in the first place.
Thanks for continuing to read this, and asking interesting questions that over time, are hopefully the right ones.
Optimistically,
Owen C. Woolcock